CIS - Cluster Information Service
Jan Astalos
Department of Parallel & Distributed
Computing
Institute of Informatics
Slovak Academy of Sciences
Description
Cluster Information Service (CIS) provides clients with the information
about availability of resources in Linux cluster. This information is necessary
for workload allocation and better utilization of resources (CPU, memory
and network).
Background
Looking at the trends in high performance computing, you can see still
more people switching from expensive supercomputers to much cheaper computer
clusters. Reasons are good price/performance ratio, ease of maintenance
and upgrading of hardware and still more free software available on the
web. Clusters are used for both HTC (High Throughput Computing) and HPC
(High Performance Computing). If you have a lot of independent tasks and
you just want a system for efficient workload distribution, you fall info
the first category and you need to get a good queuing system such as LSF.
But if you have parallel application with highly communicating tasks, you
may want to balance not only CPU load but also network load. Unfortunately,
there is still lack of good freely available monitoring systems with low
intrusiveness usable in computer clusters.
Purpose
CIS is intended to give a deeper look into a Linux cluster. If you need
a monitoring system for resource management or if you just don't want to
have a number of windows with top utility, it may help you. It is designed
to have as low impact on monitored system as possible. Mainly by its:
-
structure
-
data transfer
-
kernel instrumentation
Structure

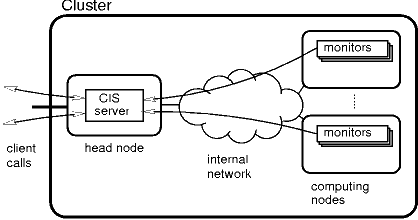
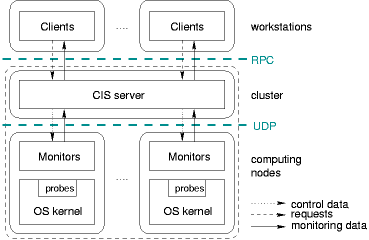
CIS consists of servers and monitors. Server (cisd) runs on head node
of cluster which is usually not used for computations and acts as front-end.
Monitors (sysmon, procmon, sockmon, netmon or integrated monitor cismon)
run on computing nodes and they send information about monitored objects
to the server in regular time intervals. In addition, they inform cisd
when a monitored event occurs (at the moment object creation and destroying
is monitored). CIS clients (xcis or resource management systems) are usually
not running on computing nodes, so internal cluster network is not loaded
by client calls.
Data transfer

After initial full information monitors are sending only changed data.
Since messages are sent using UDP protocol, they are labeled with sequence
number. When server detects message loss, it will ask monitor for full
information until the data are consistent again. UDP was selected because
it's far better to send up-to-date information than retransmit obsolete
data.
Kernel instrumentation
Since Linux is most used OS in computer clusters, at this time, only Linux
monitors are available. Gathering process information from standard kernel
interface (/proc filesystem) is rather inefficient. Try to run top -d 1
and look how much of CPU time it consumes. Yes, some overhead is due to
visualization, but main part is due to multiple system calls for each process,
conversions to text format and back and due to a lot of useless information
transferred in each call. Moreover, system call for checking available
memory is _very_ inefficient in 2.2 kernel series (improved in 2.4). Information
that is completely missing are socket counters.
Therefore, CIS has monitoring probes in kernel. Probes are implemented
as kernel modules and they work by wrapping some system calls. They provide
monitors with information in binary form (whole information in one system
call). Using special netlink device, they can inform monitor whenever monitored
even occurs. Modifications in original kernel sources are minimal (export
of some symbols, and some additional information in socket structures)
so updating of kernel patch for new version of kernel (in the same series)
is quite simple.
You can run CIS also without patching your kernel. Monitors will autodetect
absence of kernel modules and fall into /proc compatibility mode. Socket
monitor won't work, but if you have embarrassingly parallel code, you won't
need it anyway. Overhead of monitoring will be much higher, but if CPU
load on your nodes is relatively stable and mean time between spawning
two processes is high (let's say, hours) you can decrease the overhead
by increasing monitoring interval.
Information provided by CIS
-
available resources on nodes
-
processes
-
communication links
-
network devices
-
LM sensors
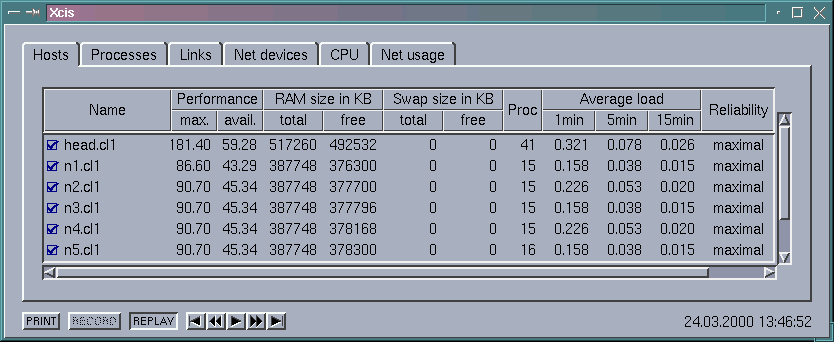
Node information
-
amount of RAM (total and available)
-
amount of swap (total and available)
-
number of processes
-
load values (1, 5 and 15 min)
-
context switch rate
-
CPU availability
CPU availability represents an estimated percentage of CPU time that can
be allocated to new process. It is computed from CPU usage and priorities
of processes. Unlike load values, reaction on changes is very fast, because
recently created processes (with unknown CPU usage characteristics) are
assumed to have 100% CPU demand.
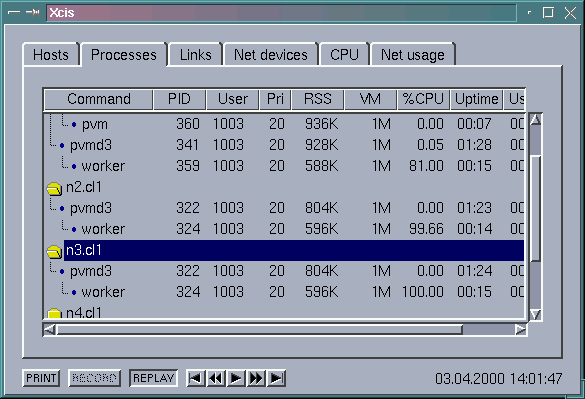
Process information
-
identification (name, pid, uid, ppid)
-
priority
-
start time
-
consumed CPU time (in system and user mode)
-
used memory (physical and virtual)
-
monitoring of major faults (swapping)
-
amount of bytes read and written to hard disk (to ext2 filesystem)
-
relative CPU time consumption [%]. This value is counted from last three
changes of consumed CPU time. The reason is to flatten big deviations.
Communication links (sockets)
-
identification (type, source and destination addresses and ports)
-
owner (pid, uid)
-
transfer rate in given interval
Network devices
-
name
-
status (up, down)
-
transfer rate in given interval in both directions
LM sensors
-
CPU temperature
-
System temperature
-
CPU fan speed
Features
Record/Replay
One of the most important features of CIS is the ability to save monitoring
information into record files, so it's possible to get long term characteristics
of parallel applications (CPU, memory and network usage patterns). This
can help resource management system in task placement decisions. Monitoring
information (both on-line and archived) can be visualized using xcis client.
CIS contains also utilities for processing record files (cut, merge, print
in readable form).
Note: This is not intended for identical rerun of nondeterministic
applications. If you need it, you have to look for some application monitor
with this feature.
Low overhead
The overhead depends on CPU speed, number of objects and number of detected
events (object creation and termination) in monitoring interval. On Intel
Pentium III 550 MHz (quite common in today's clusters) with 384 MB of RAM,
one 100Mbit network interface and monitoring interval one second the CPU
and network overhead was:
| |
interval |
sysmon
|
procmon
|
sockmon
|
netmon
|
top
|
|
[s]
|
%CPU |
transfer [Bps]
|
%CPU |
transfer [Bps]
|
%CPU
|
transfer [Bps]
|
%CPU
|
transfer [Bps]
|
%CPU
|
transfer [Bps]
|
|
empty
|
1
|
0.01
|
67
|
0.01
|
46
|
<0.01
|
119
|
<0.01
|
46
|
1.5
|
1743
|
|
loaded
|
1
|
0.01
|
75
|
0.01
|
96
|
<0.01
|
272
|
<0.01
|
45
|
1.66
|
1647
|
|
empty
|
0.1
|
0.11
|
750
|
0.13
|
491
|
0.05
|
1289
|
0.05
|
402
|
|
|
|
loaded
|
0.1
|
0.12
|
750
|
0.18
|
904
|
0.08
|
2021
|
0.06
|
402
|
|
|
Since monitors were consuming less than one OS clock tick, for correct
measurement it was necessary to patch the kernel for precise time accounting
(see links section). Precision of CPU measurements in CIS is 0.01% so it
was not possible to measure the CPU overhead of sockmon and netmon. In
empty state there was 13 processes (including monitors) on the node. In
loaded state there were in addition 10 tasks computing and communicating
in cycle. For comparison overhead of top utility with the same monitoring
interval is in the table. The node was quite heavy loaded and probably
that's why transfer rate of top is lower (it couldn't get as much CPU time
as in empty state).
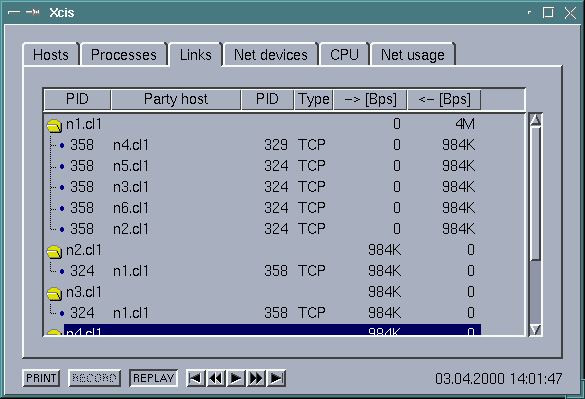
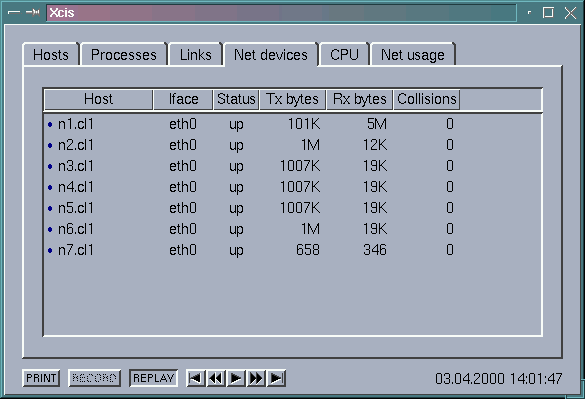
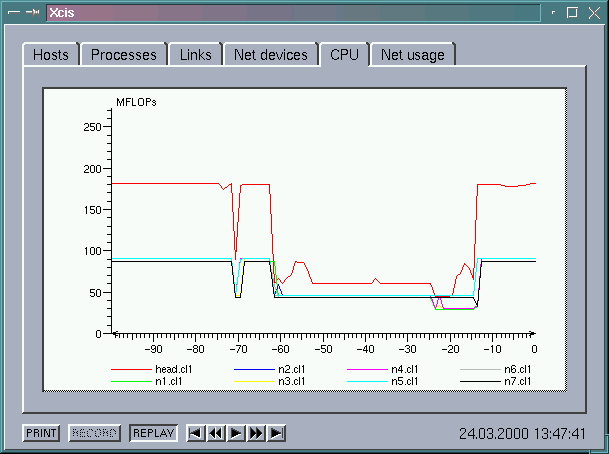
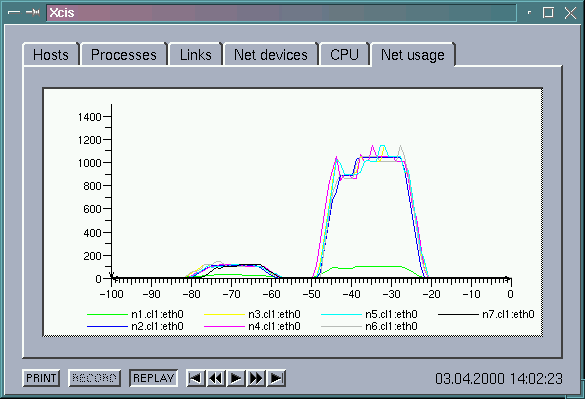
Screenshots from xcis client


Availability
Cis package is (except of CIS library which is distributed under LGPL license)
distributed under the terms of GPL
General Public License. It is running on OS Linux, x*86 architecture,
and kernel version 2.2 and 2.4.
Download: cis-0.9.5.tar.gz archive
Xcis client is written in Open Motif/Lesstif and it requires Microline
Widget Library which is distributed under Netscape Public License as a
part of mozilla source tree mozilla-19981008.tar.gz. It also requires plot_widget
library.
Download: Microline3.0.tar.gz http://www-pat.fnal.gov/nirvana/plot_wid.html
Xcis is distributed under GPL
General Public License with a special exception that allows you to
link the executable with the two libraries above.
Download: xcis-0.9.5.tar.gz
Modified resource manager for PVM (Parallel Virtual Machine) with load
balancing based on CIS information.
Download: srm-cis.tar.gz
Related links
Precise
time accounting in Linux
SCMS - SMILE
Cluster Management System
NWS - Network Weather Service
